Fair Practices

Openly sharing our commitment to diverse, equitable, and inclusive people practices
A diverse group of teammates sitting outside at table

Our diversity metrics

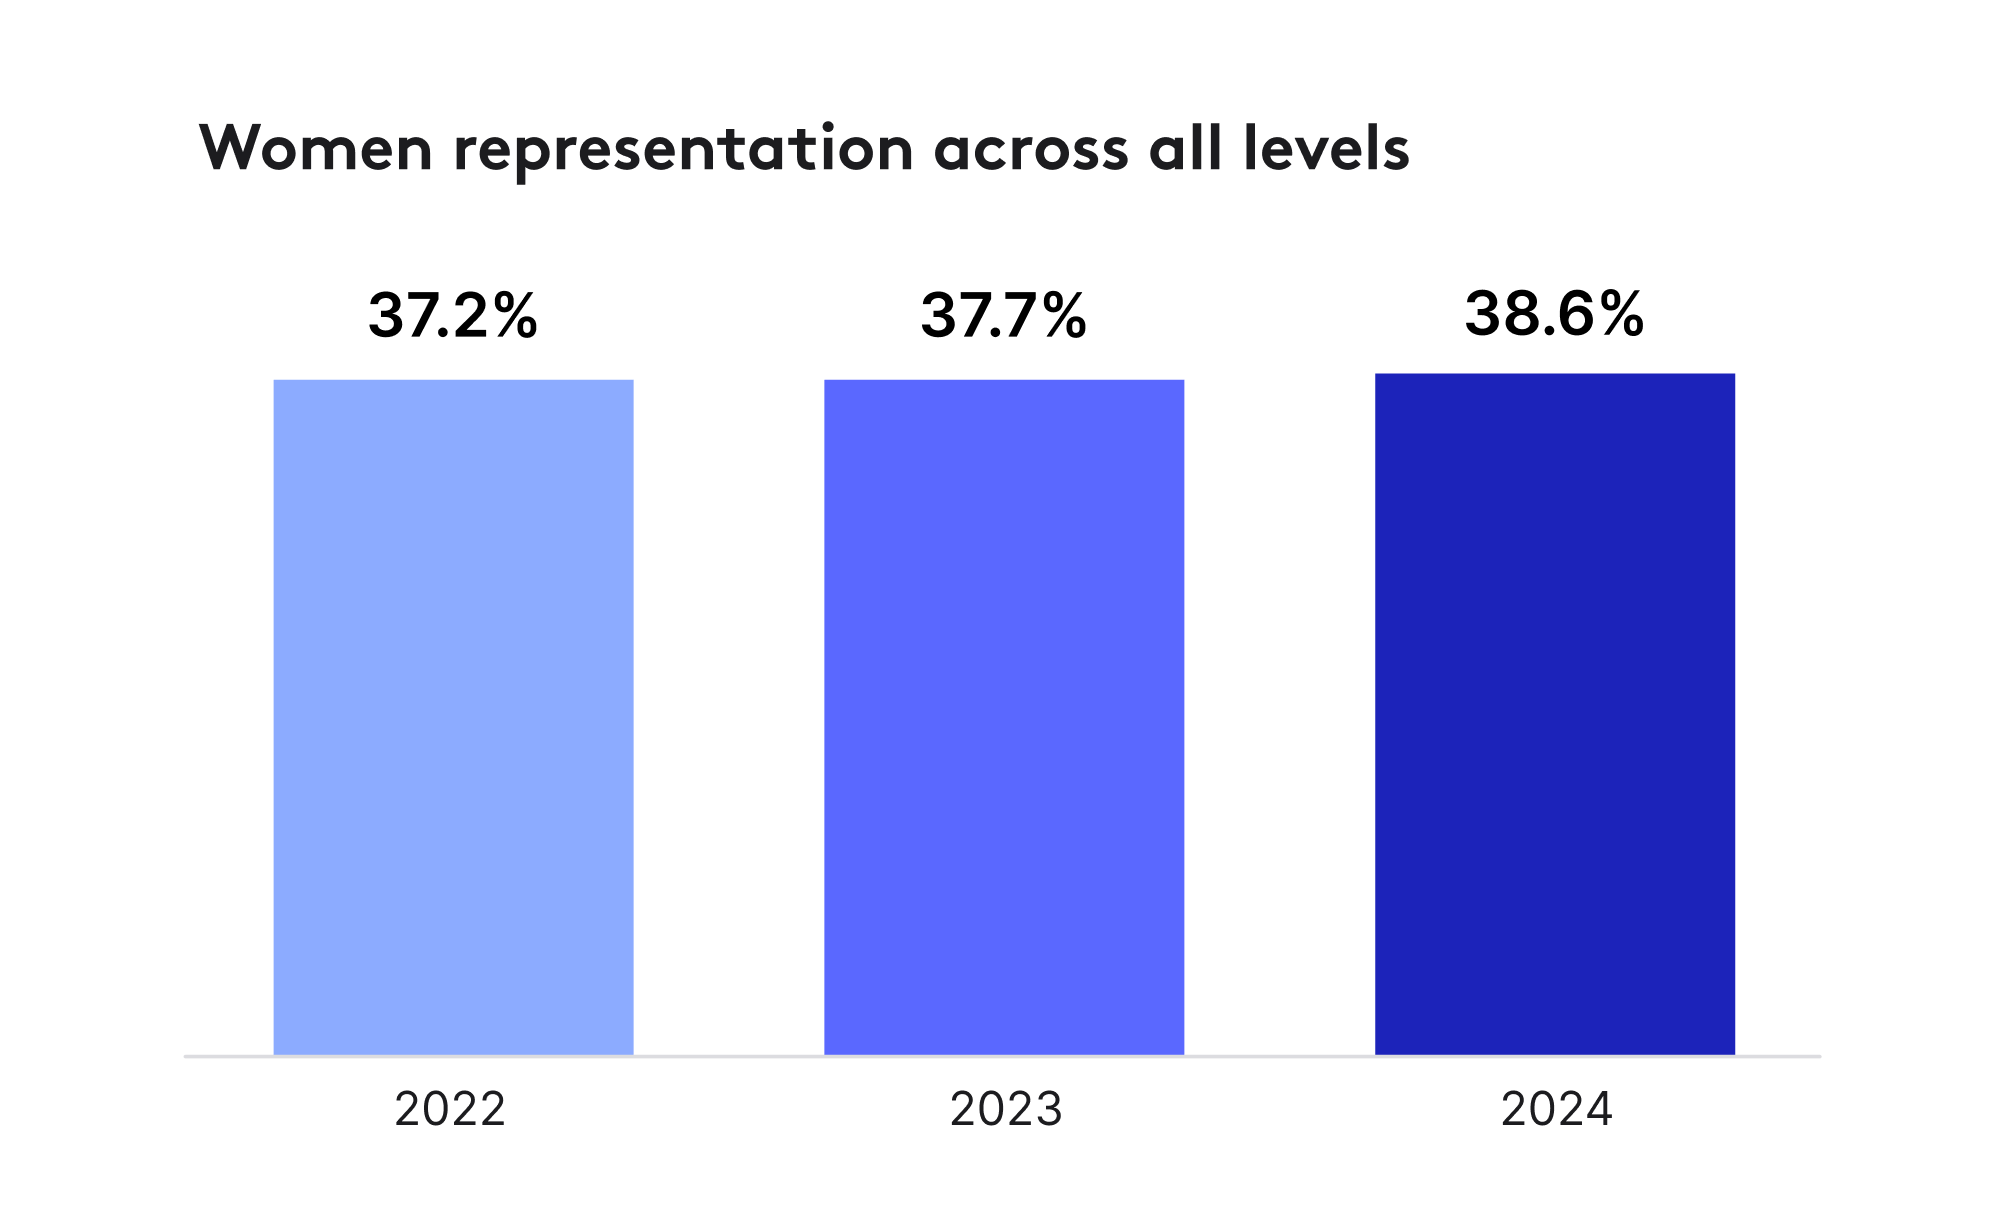
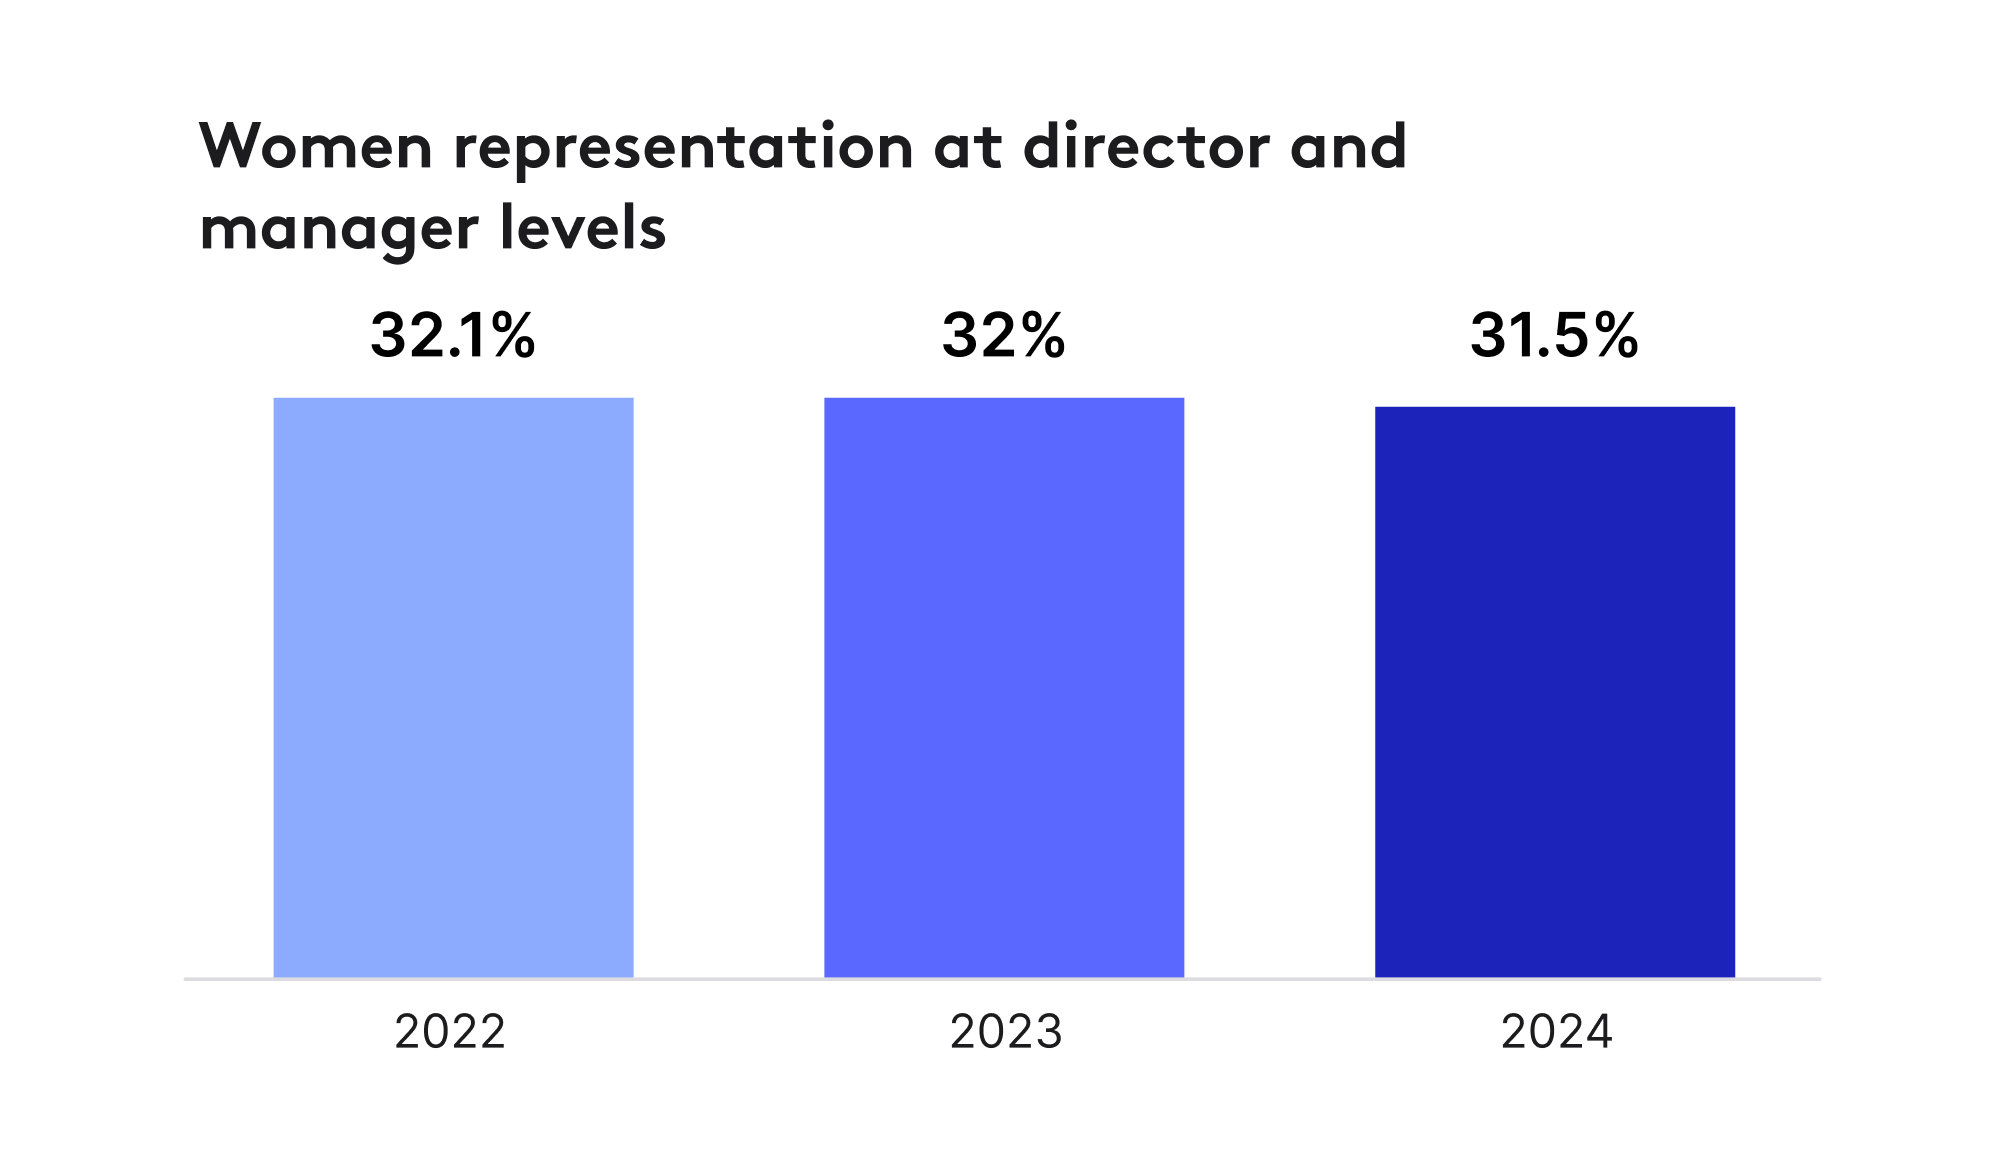
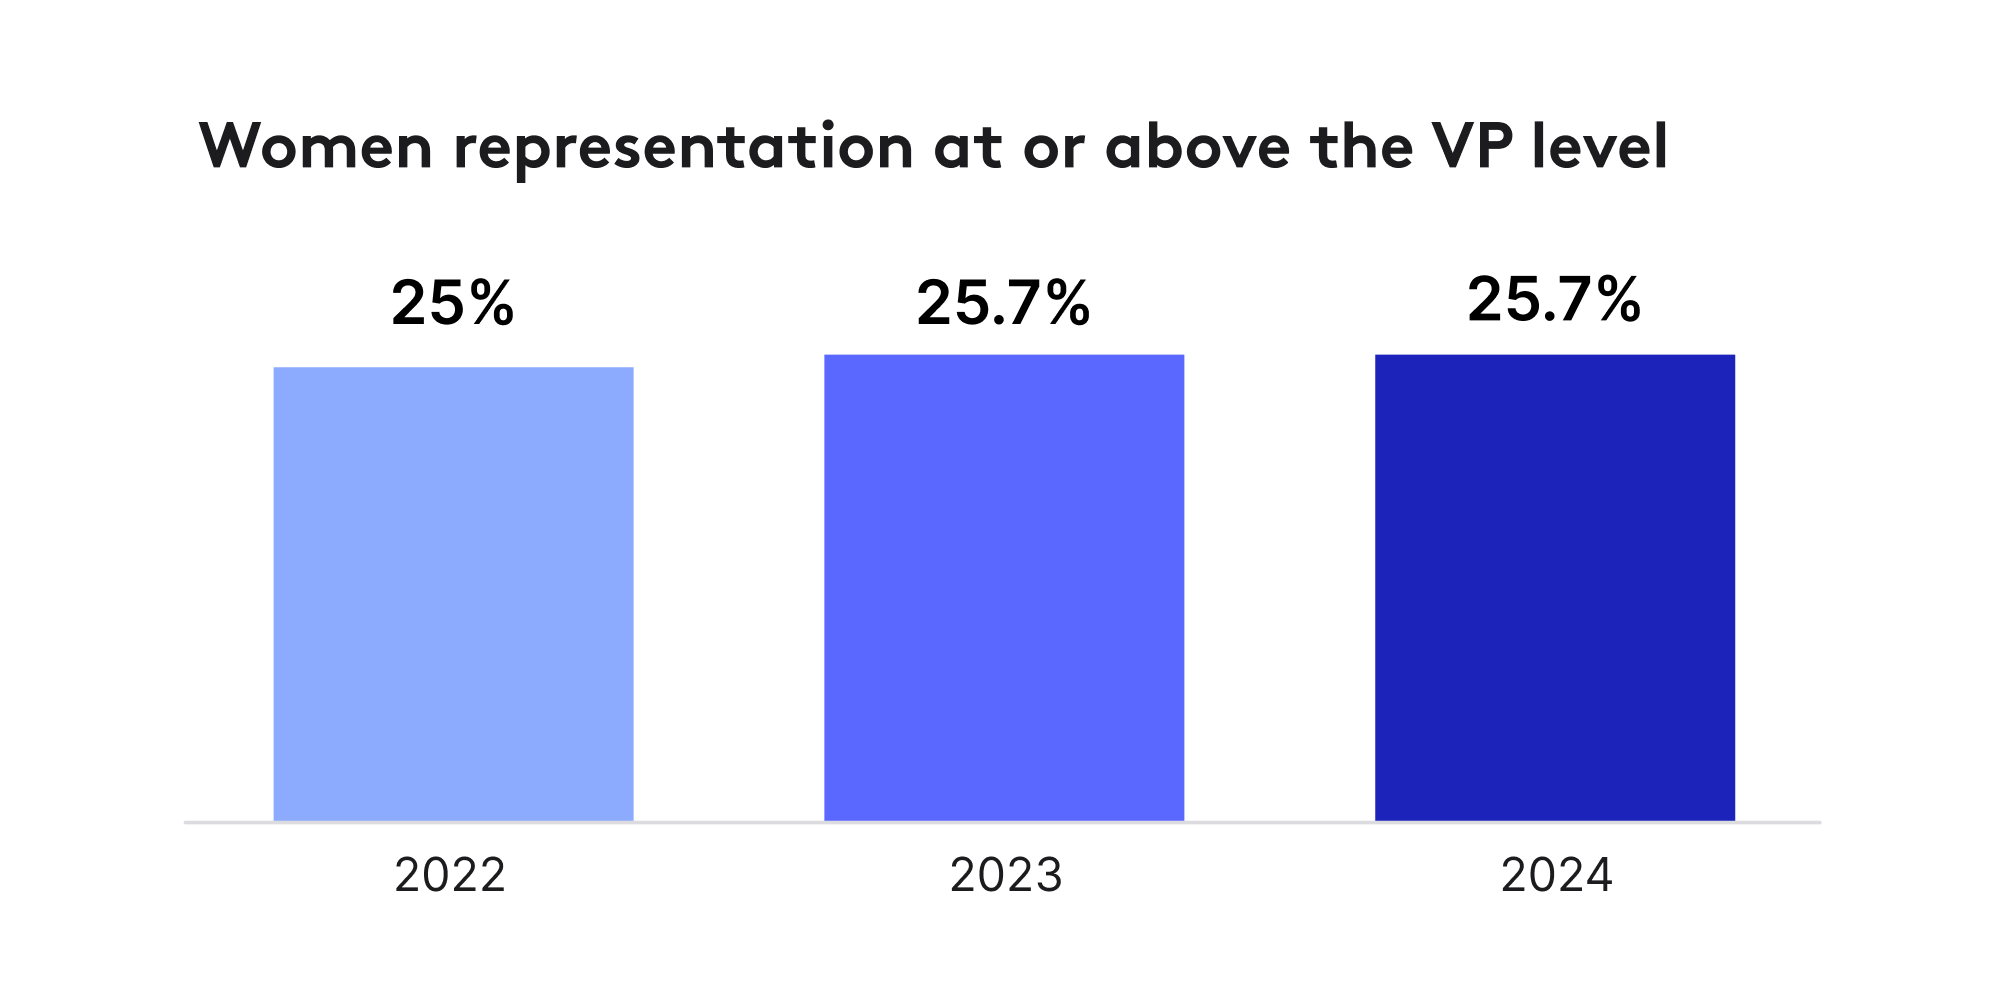
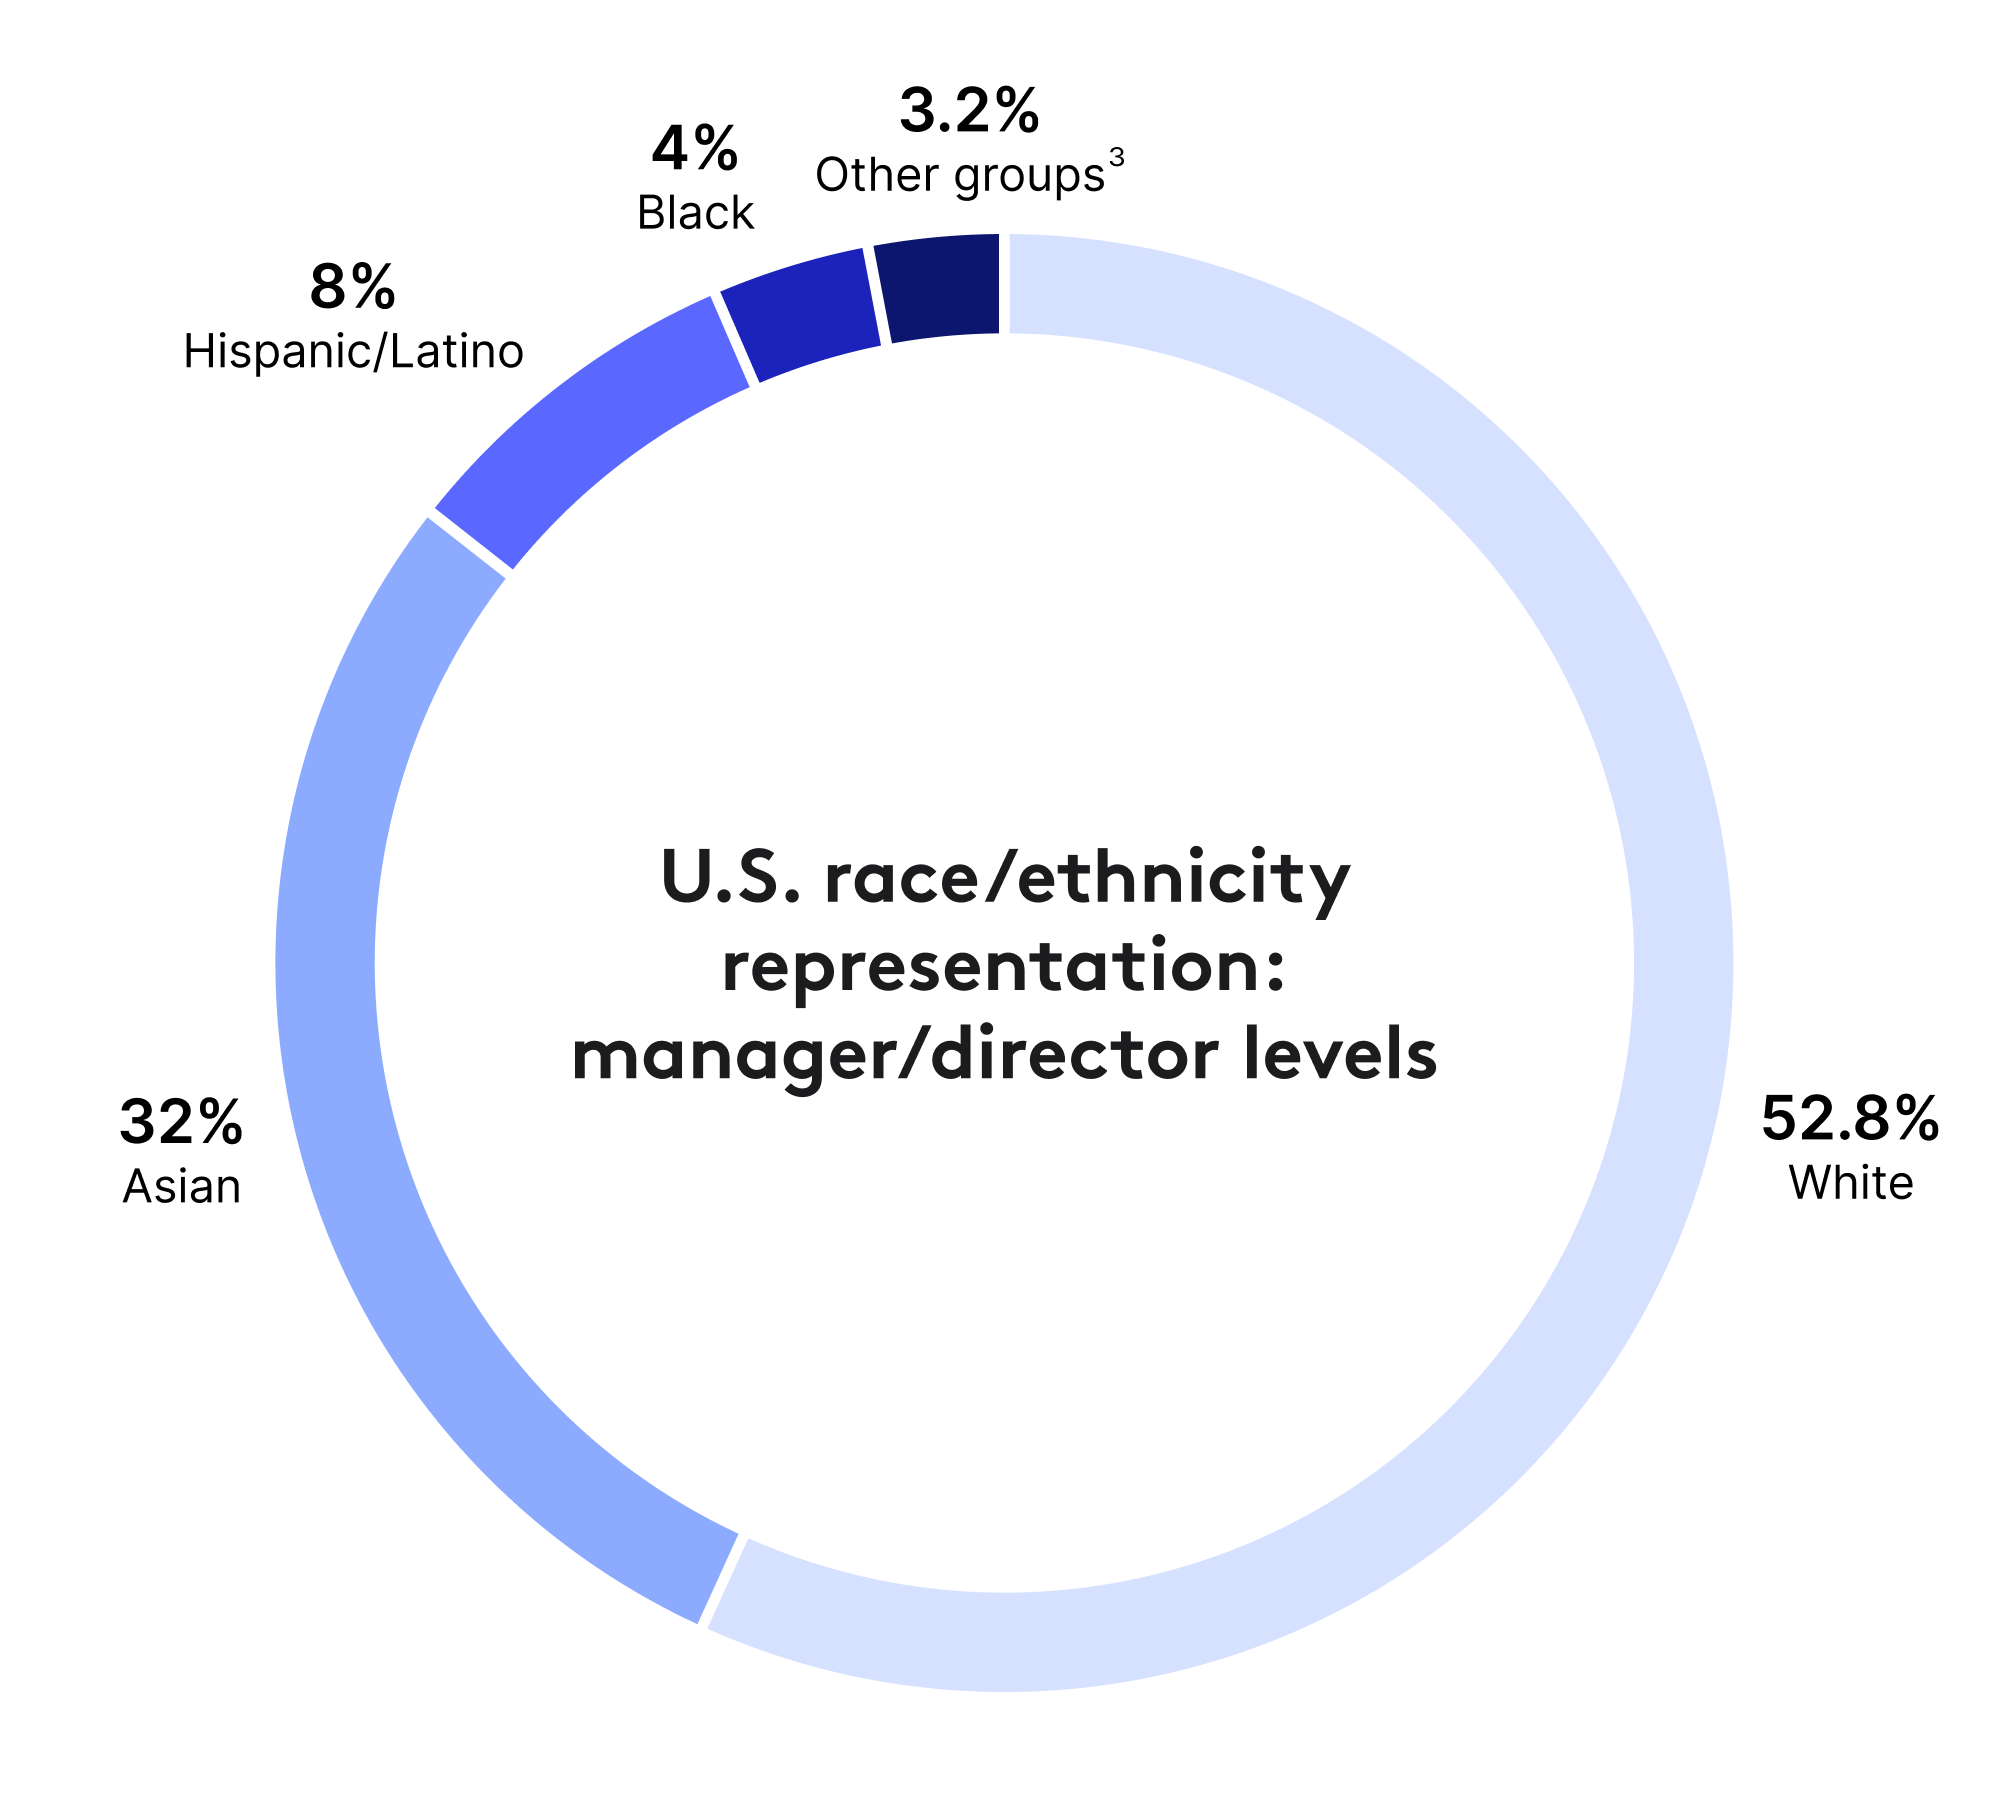
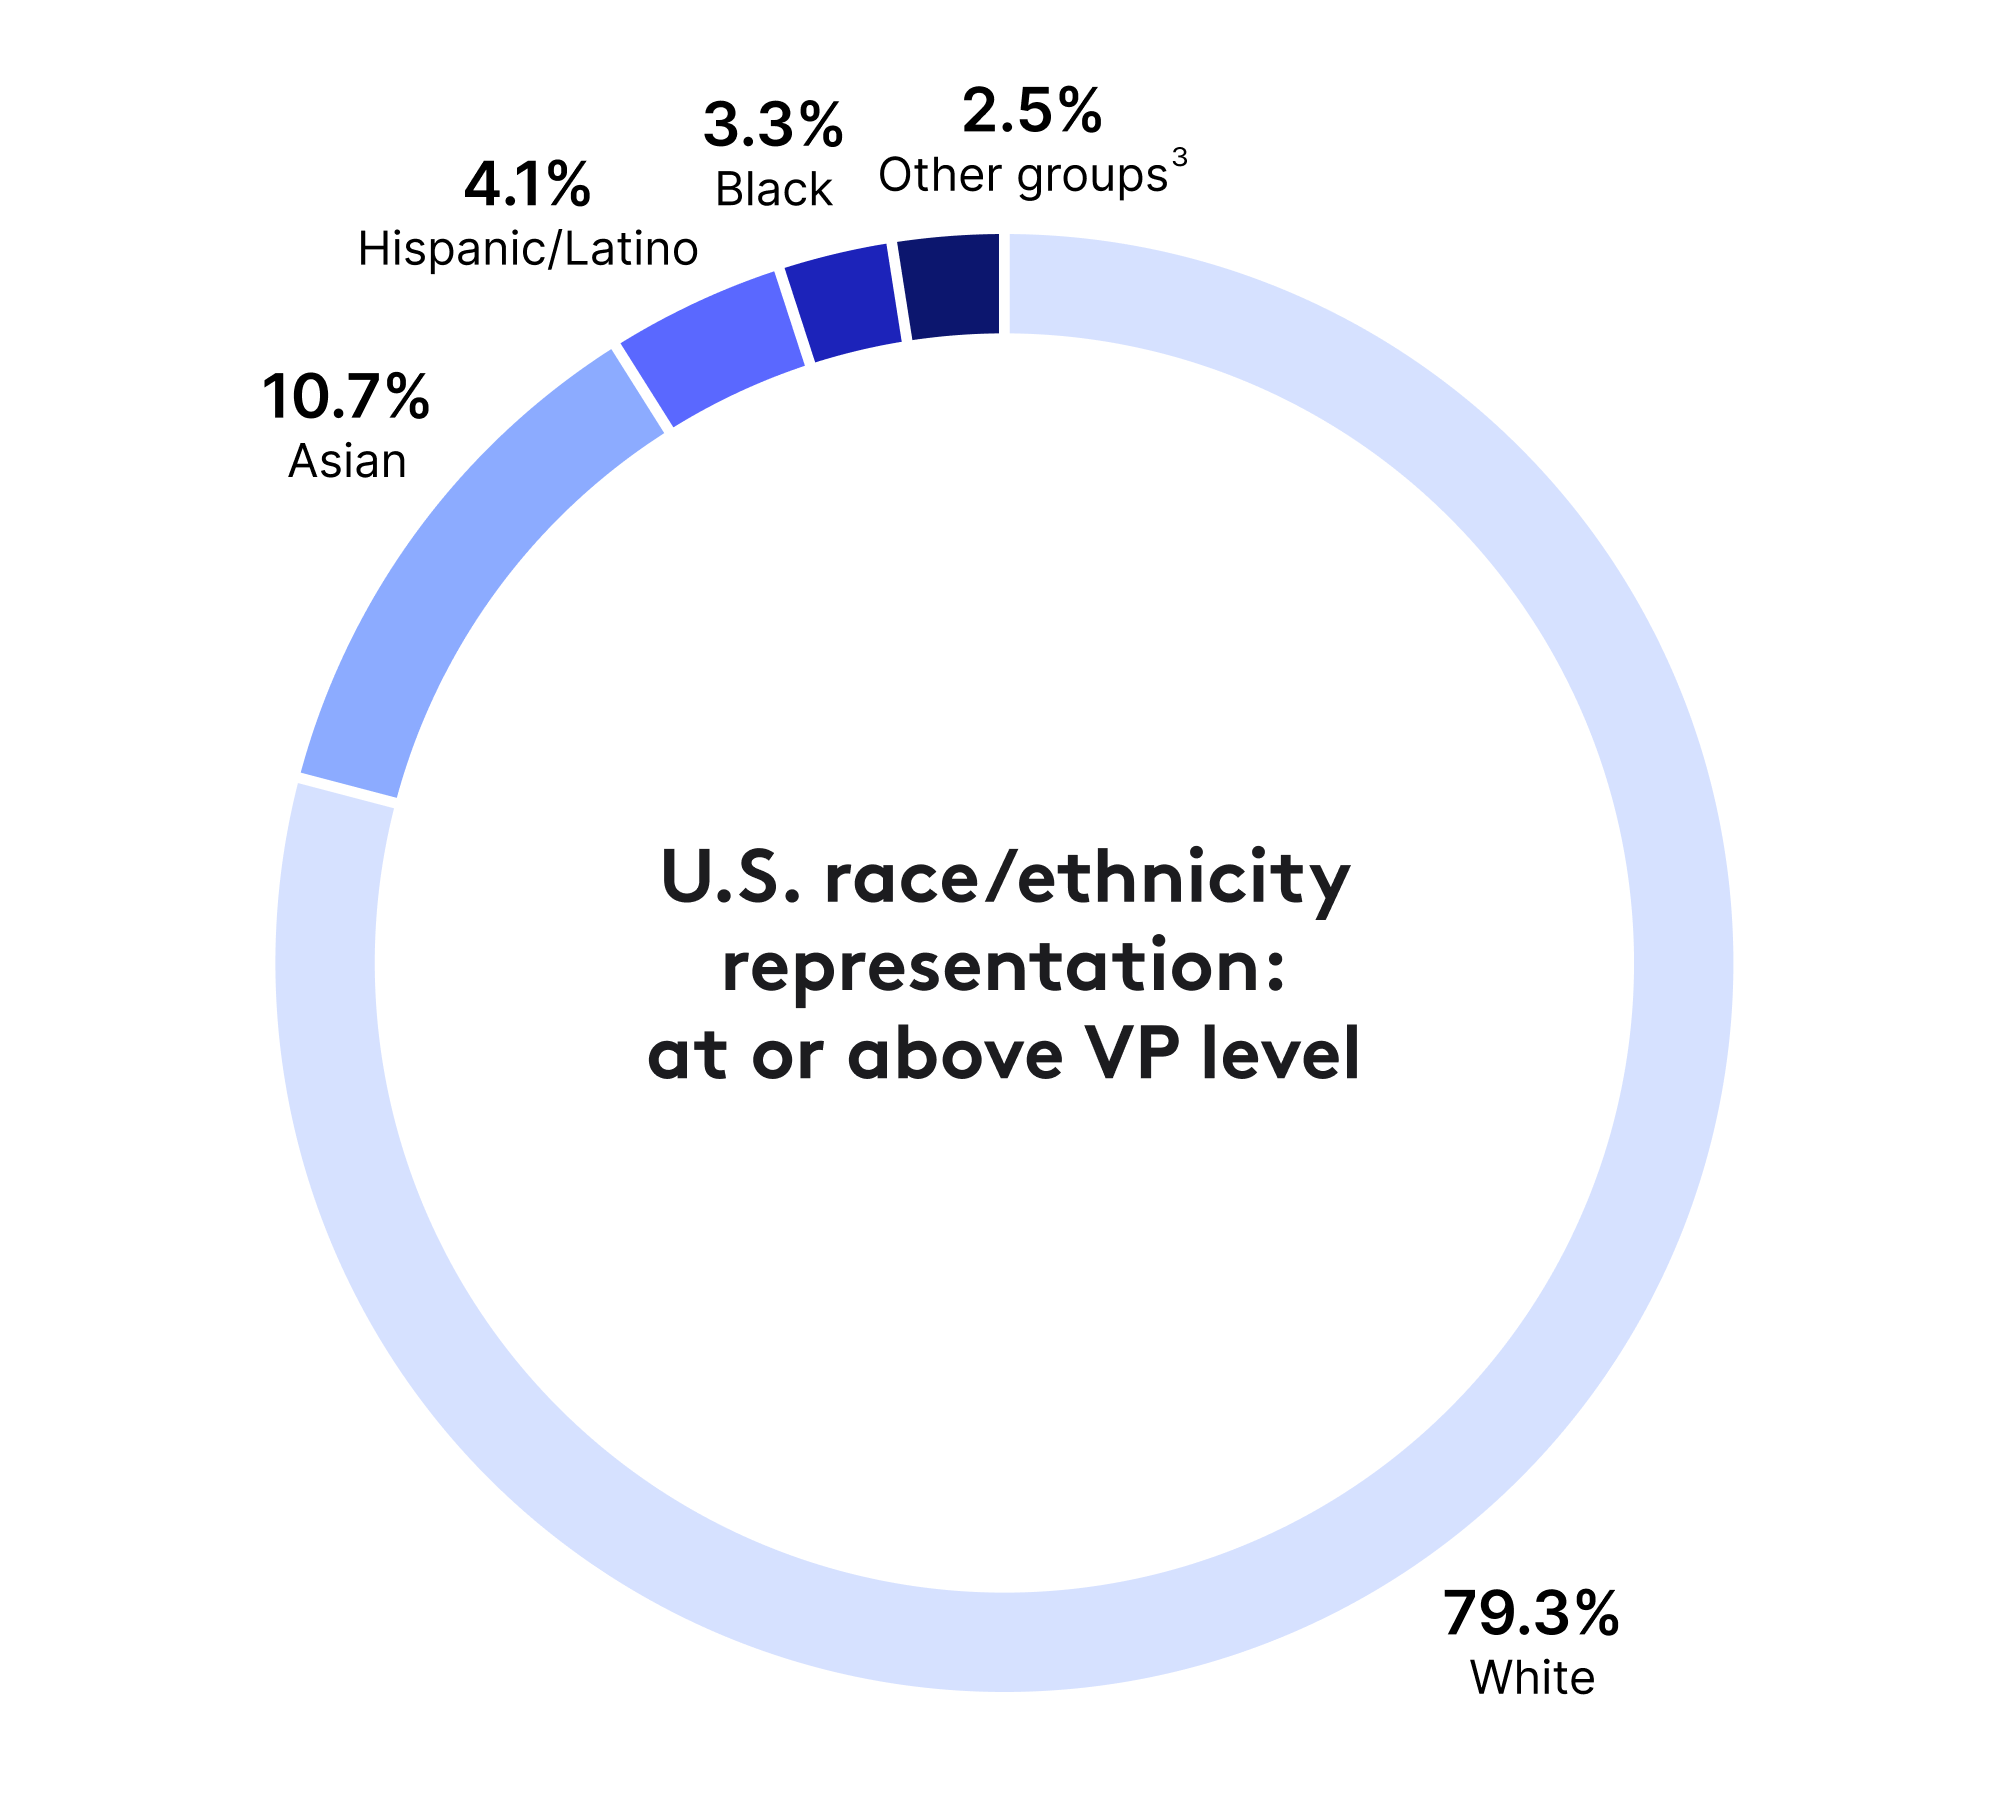
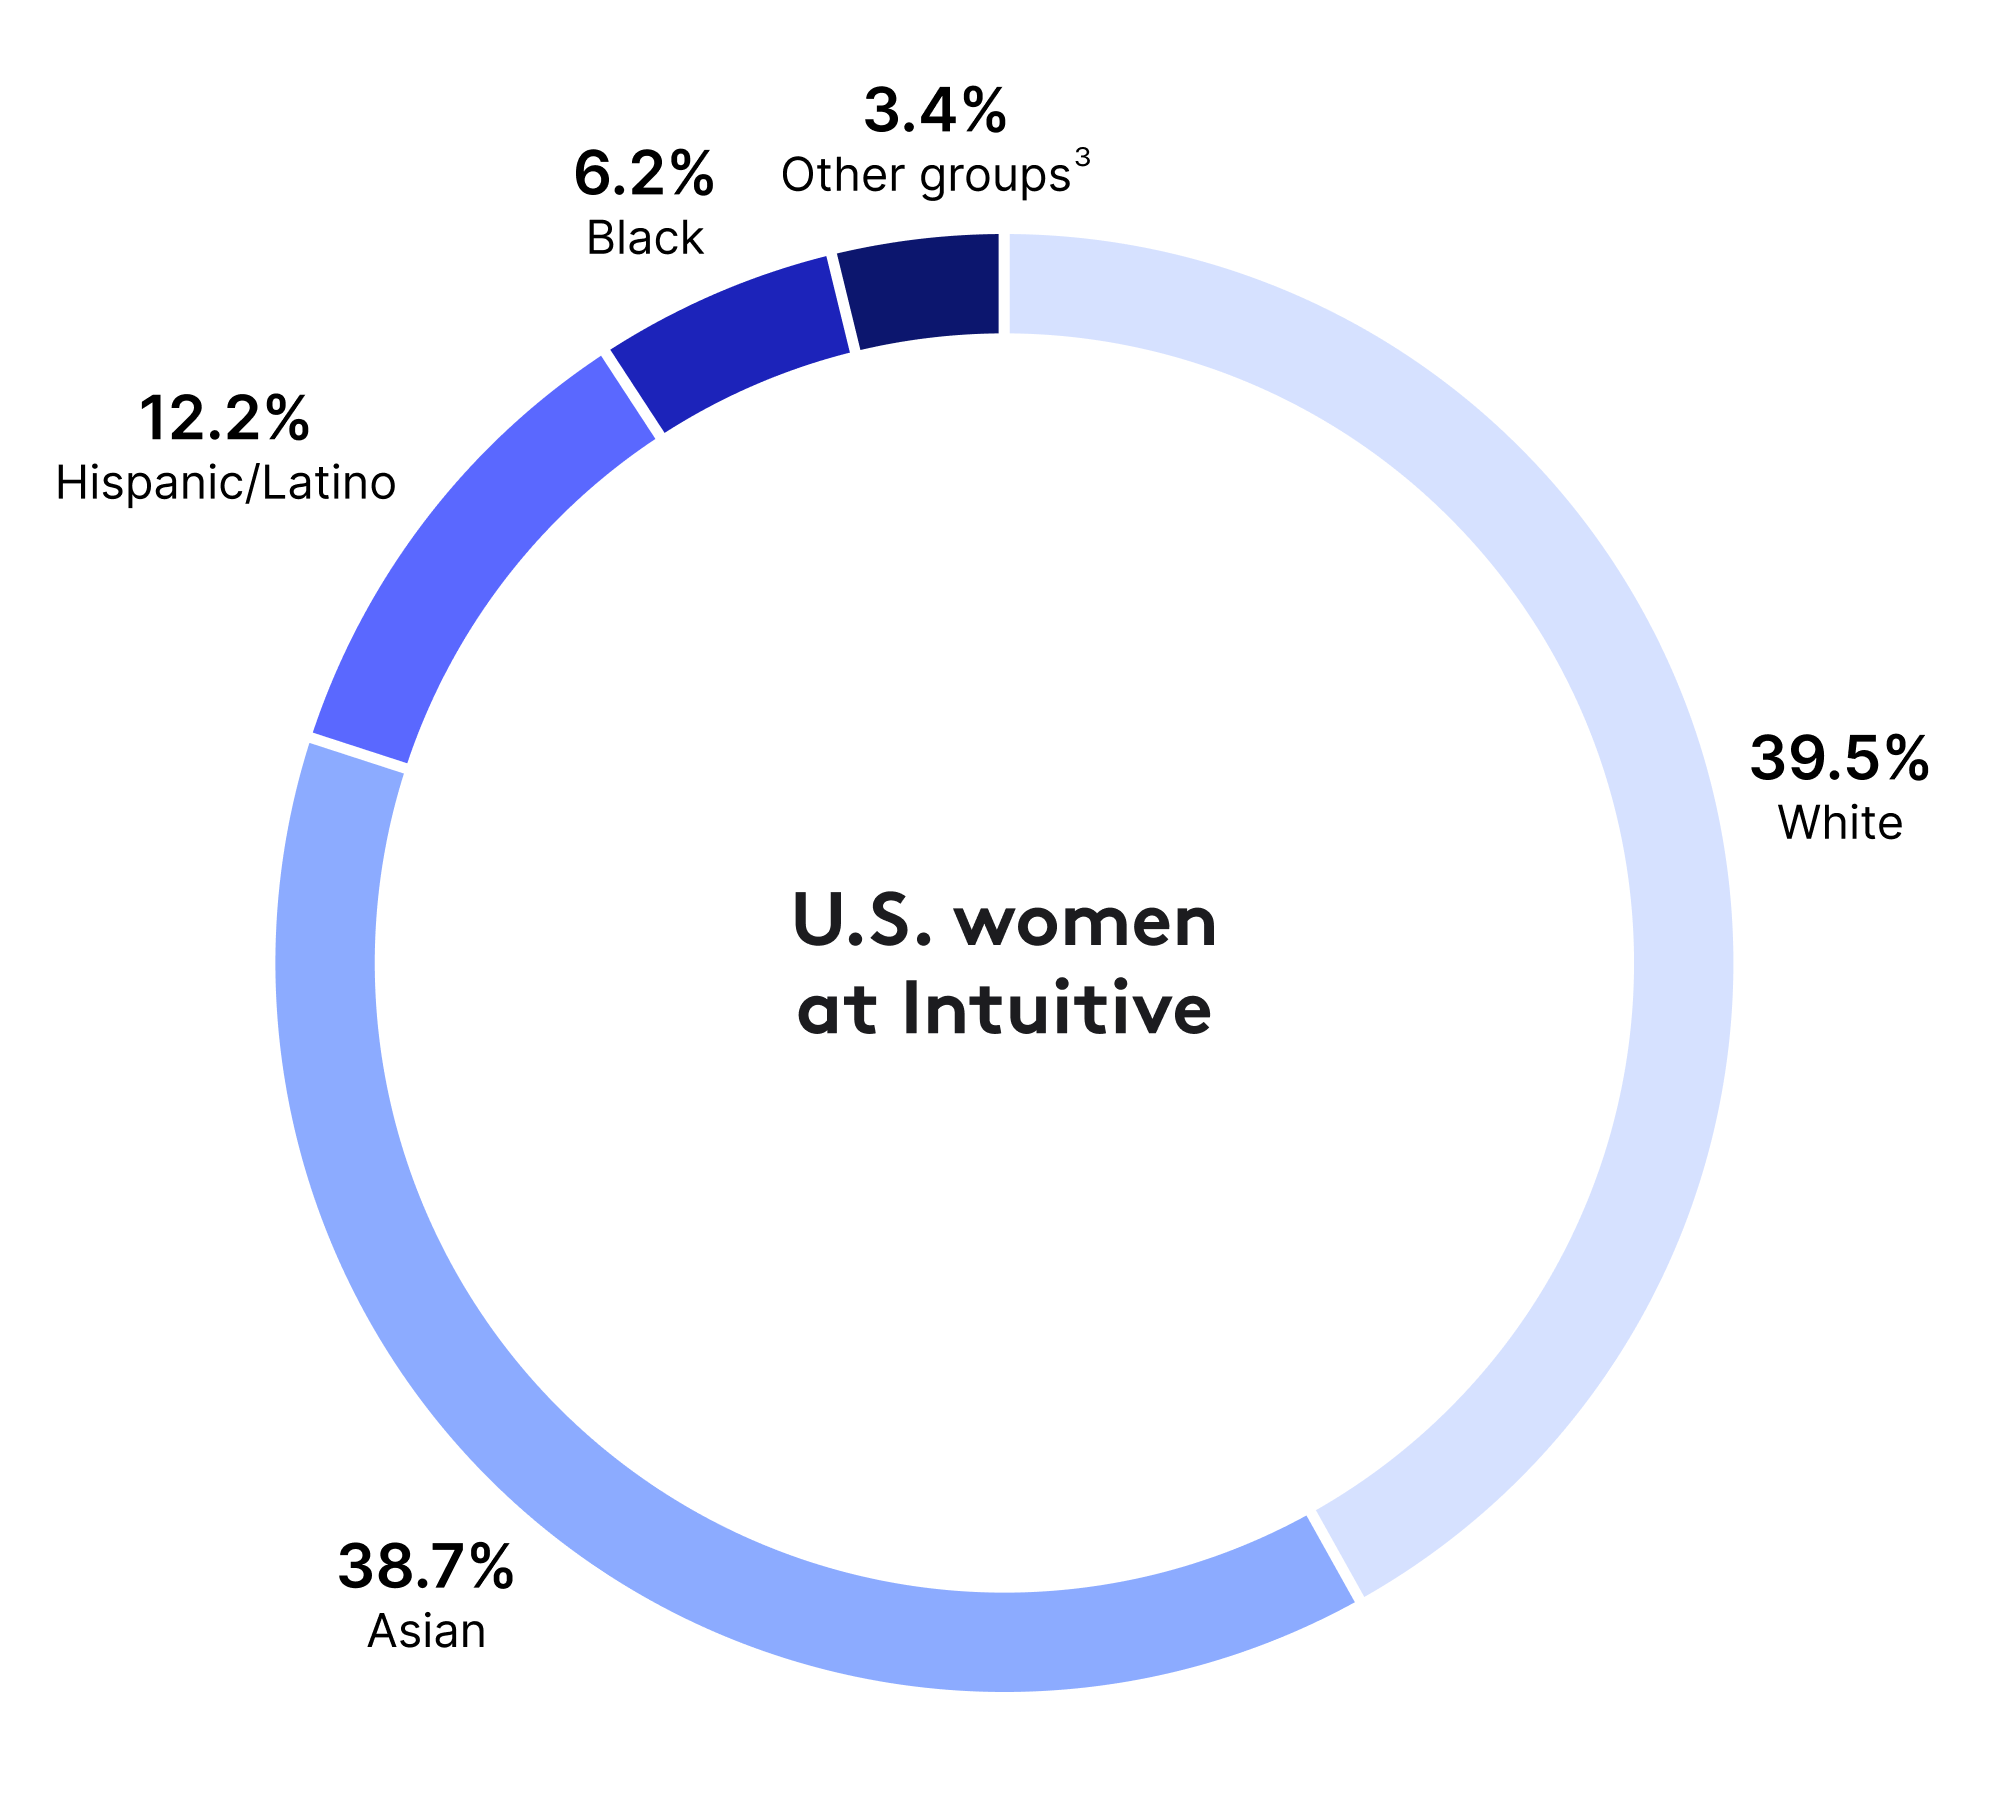
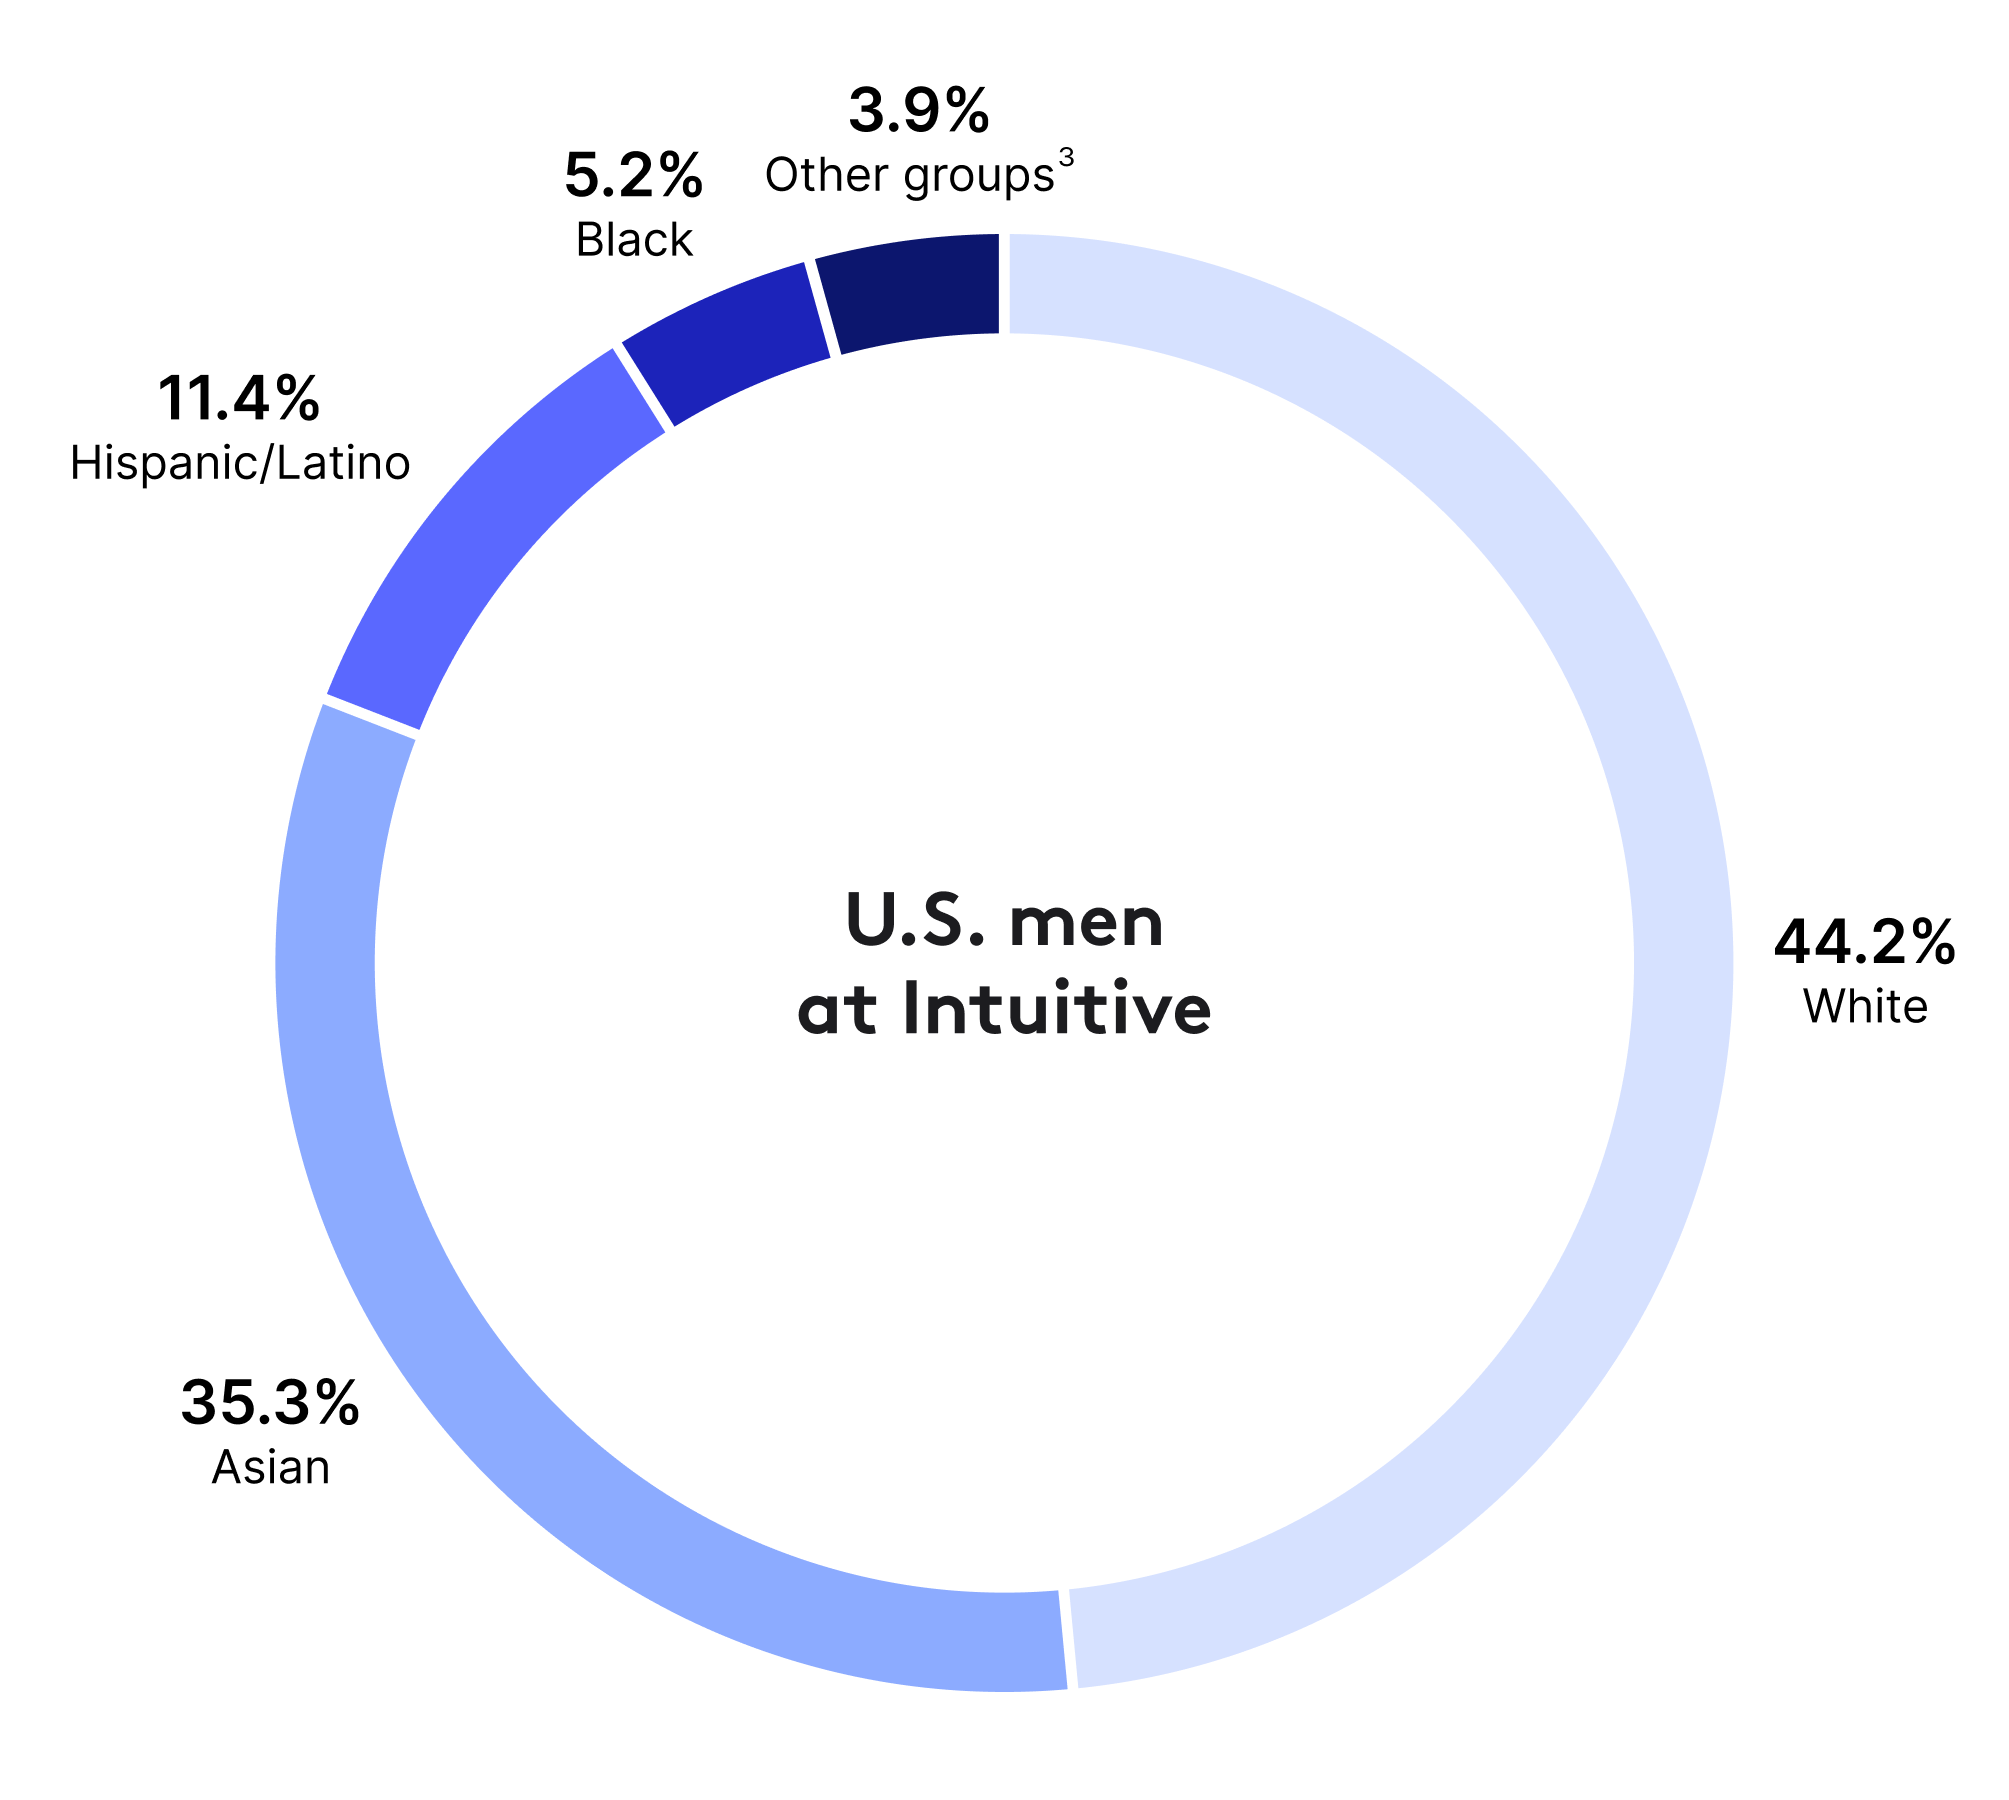
Below are Intuitive’s diversity metrics for global gender and U.S. race/ethnicity. Figures include all regular employees with self-disclosed gender and/or race/ethnicity data.

Global gender representation1, 2

Women representation from 2020 through Q2 2022

Women as directors and managers from 2020 through Q2 2022

Women at or above the VP level from 2020 through Q2 2022

U.S. race/ethnicity representation1, 2

Overall U.S. staff race and ethnicity representation

U.S. manager and director staff levels race and ethnicity representation

U.S. gender and race/ethnicity mix1, 2

U.S. women representation by race/ethnicity percentages

U.S. men representation by race/ethnicity percentages

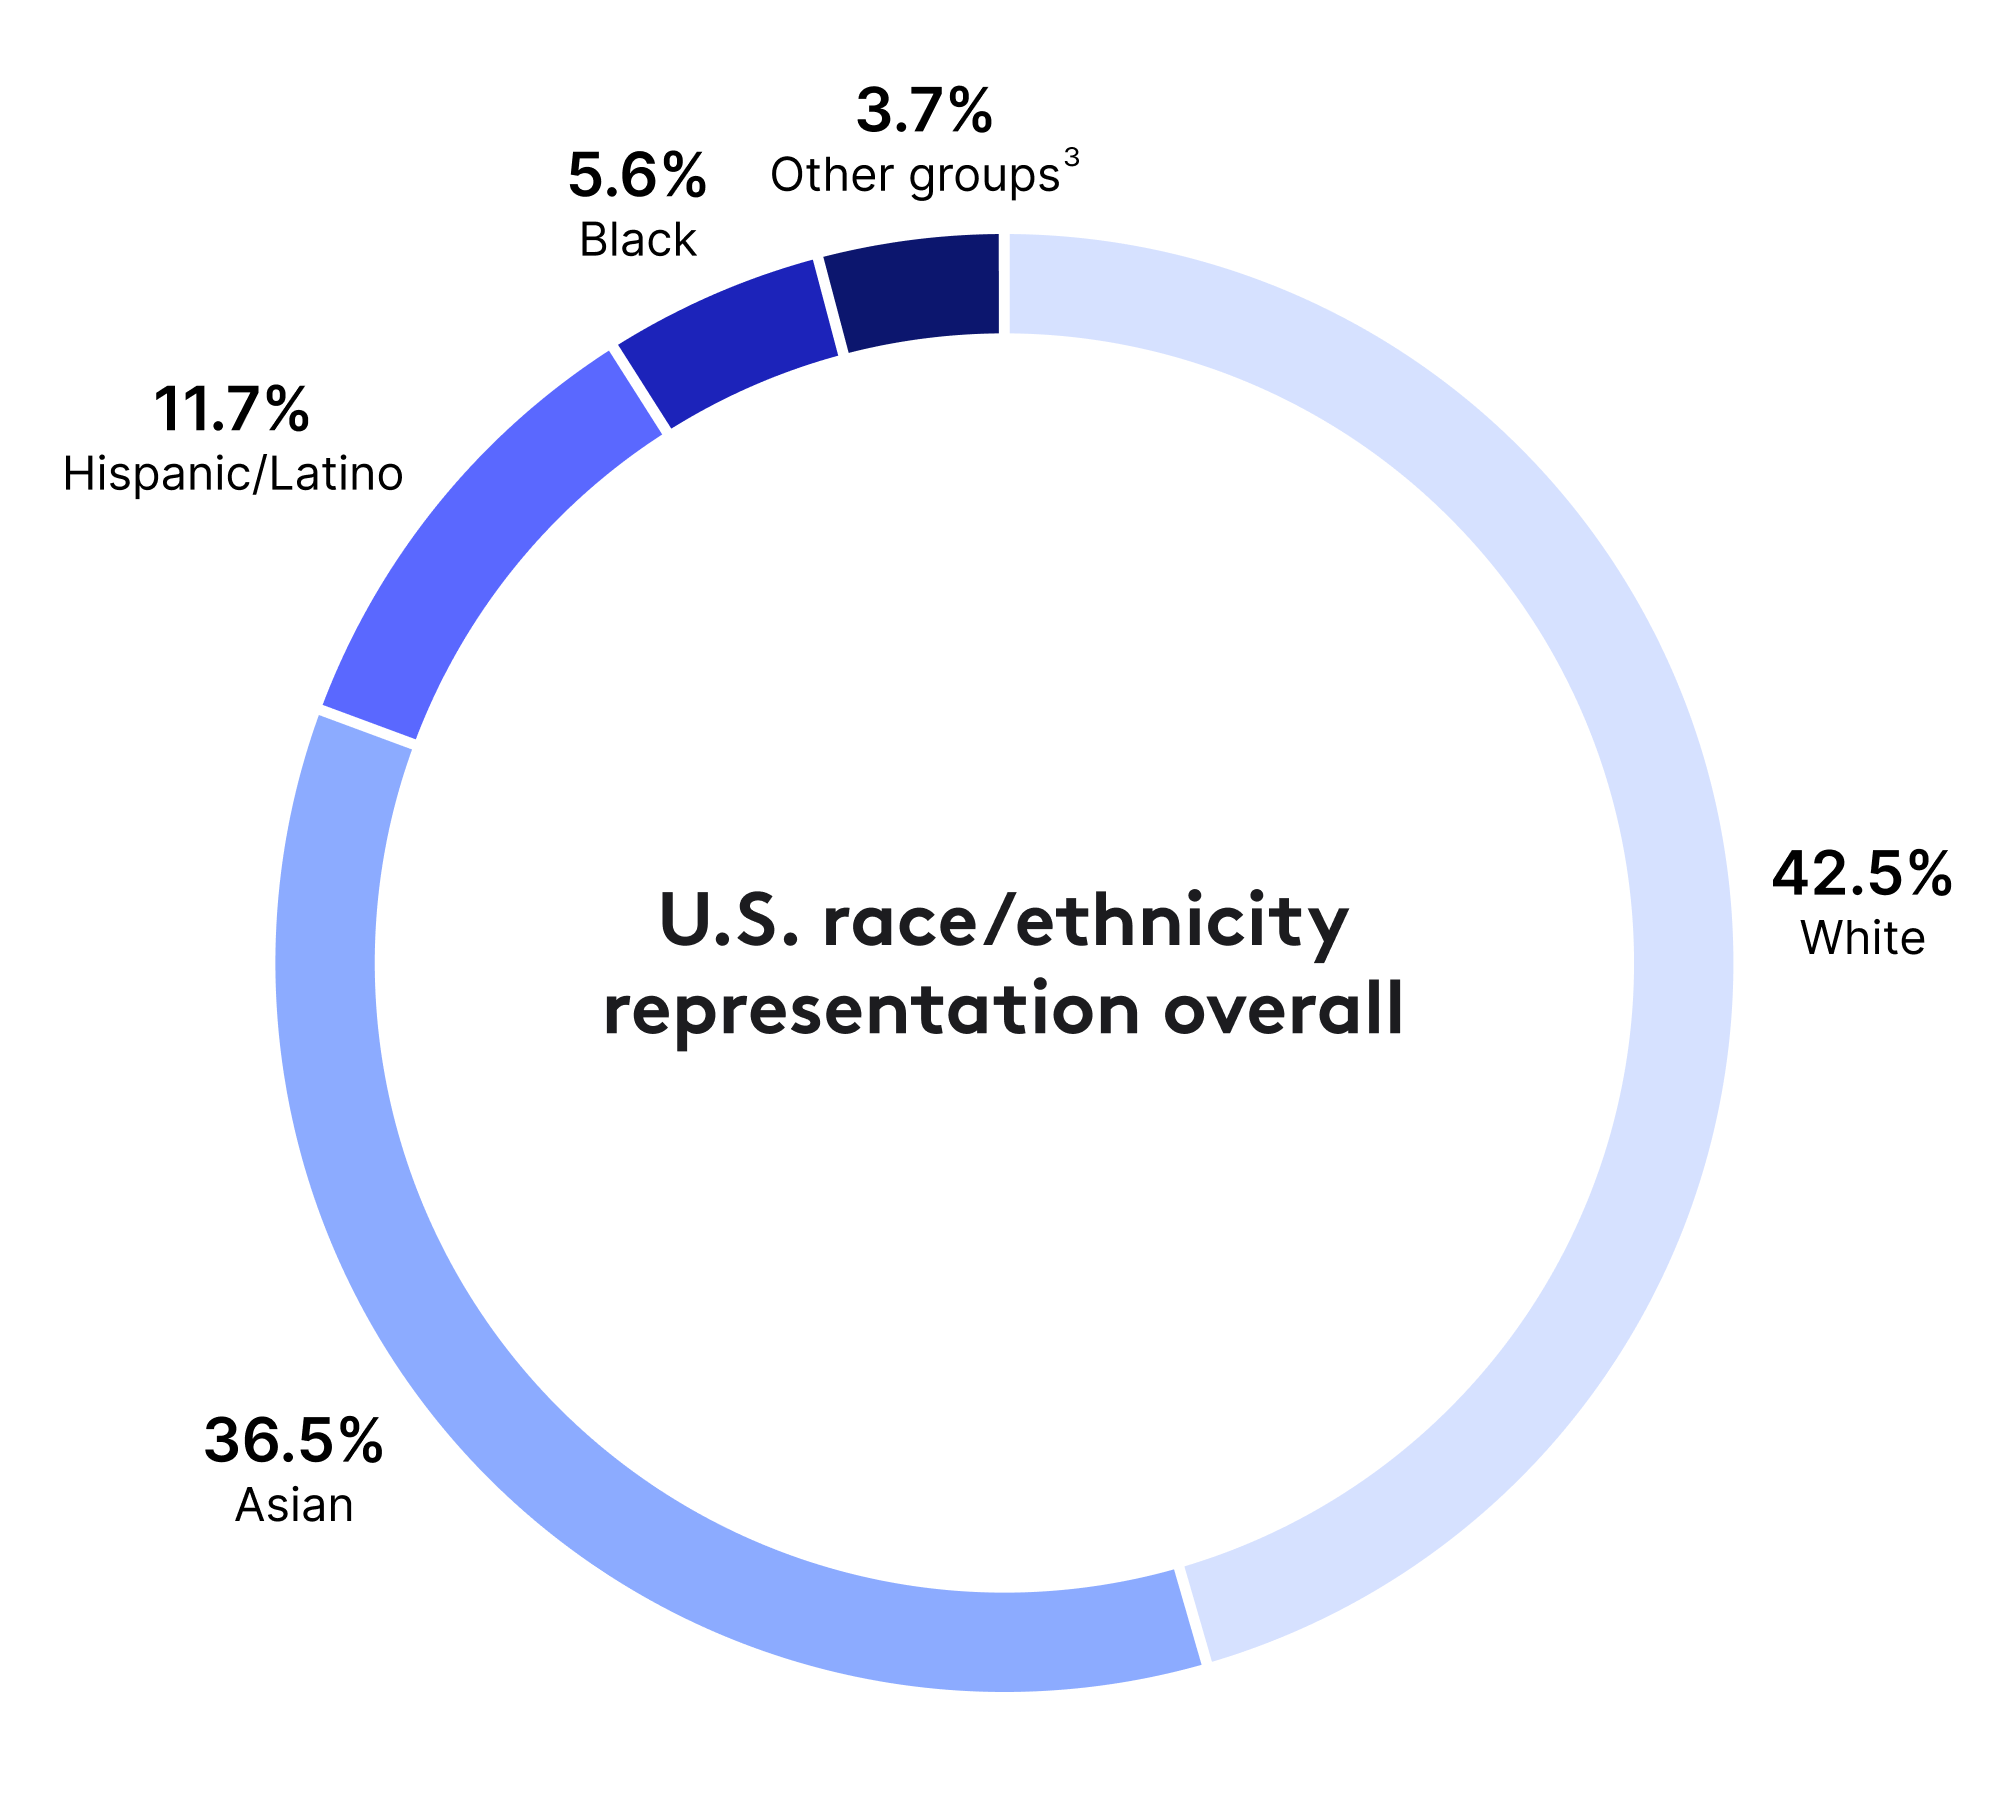
View Intuitive’s most recent EEO-1 report which reflects U.S. government reporting requirements here.

Smiling employee sitting in chair
  1. Reflects Intuitive regular employee self-identified data.
  2. Data as of December 31, 2023. Percentages may not add to 100 due to rounding.
  3. “Other groups” category includes: Native American/Alaskan Native, Hawaiian/Pacific Islander, and two or more races.